Configure Hibernate with DataSource Proxy
Why Use a DataSource Proxy?
The Hibernate user guide recommends using a DataSource proxy instead of default logging frameworks like Log4j or Logback. While traditional logging frameworks can show you SQL statements, a DataSource proxy gives you much more insight into what's happening at the JDBC level.
Benefits of using a DataSource proxy:
- Statement execution time - See how long each query takes, making performance issues easier to spot
- JDBC batching logs - Verify that batch operations are actually being batched, not executed one by one
- Database connection monitoring - Track connection acquisition and release patterns
- N+1 query detection - Assert the expected number of queries in tests, catching performance problems early
Traditional logging frameworks like Logback can be configured via spring-logback.xml to define multiple appenders with custom patterns. However, they don't provide colored output by default, which makes scanning through logs much harder. We'll address both issues by combining a DataSource proxy with a properly configured Logback setup.
Setting Up the DataSource
Step 1: Configure HikariCP Properties
First, define your basic datasource configuration in application.yml. HikariCP is the default connection pool in Spring Boot and offers excellent performance out of the box:
spring:
  application:
    name: demo

  datasource:
    driver-class-name: org.postgresql.Driver
    url: jdbc:postgresql://localhost:5432/postgres
    username: postgres
    password: ***
    hikari:
      maximum-pool-size: 10
      minimum-idle: 5
      connection-timeout: 30_000

  jpa:
    hibernate:
      ddl-auto: update
Step 2: Create the HikariDataSource Bean
Create a configuration class to build the HikariDataSource. The @ConfigurationProperties annotation binds the YAML properties to the HikariDataSource:
@Bean
@ConfigurationProperties("spring.datasource.hikari")
public HikariDataSource hikariDataSource(DataSourceProperties properties) {
    return properties.initializeDataSourceBuilder()
            .type(HikariDataSource.class)
            .build();
}
This bean uses Spring Boot's DataSourceProperties to initialize a HikariDataSource with the properties we defined in YAML. The @ConfigurationProperties prefix ensures all properties under spring.datasource.hikari are automatically applied.
Step 3: Wrap with DataSource Proxy
Now wrap the HikariDataSource with the datasource-proxy library. This is where the magic happens. Mark this bean as @Primary because you now have two DataSource implementations (the raw HikariDataSource and this wrapped version), and Spring needs to know which one to inject by default:
@Bean
@Primary
public DataSource dataSource(HikariDataSource hikariDataSource) {
    var listener = new SLF4JQueryLoggingListener();
    listener.setWriteDataSourceName(false);
    listener.setWriteConnectionId(false);

    return ProxyDataSourceBuilder.create(hikariDataSource)
            .name("DS-Proxy")
            .listener(listener)
            .logSlowQueryBySlf4j(500, TimeUnit.MILLISECONDS)
            .build();
}
Let's break down what each part does:
Listener Configuration:
SLF4JQueryLoggingListener- Routes query logs through SLF4J (which feeds into Logback)setWriteDataSourceName(false)- Hides the datasource name from logs (keeps output cleaner)setWriteConnectionId(false)- Hides connection IDs from logs
Proxy Builder:
name("DS-Proxy")- Names the proxy for identificationlistener(listener)- Attaches our configured listenerlogSlowQueryBySlf4j(500, TimeUnit.MILLISECONDS)- Logs queries that take longer than 500ms as slow queriesbuild()- Creates the proxy wrapping your HikariDataSource
The proxy intercepts all JDBC calls between your application and the database, logging them according to your configuration without changing any application code.
Logback Configuration with Colored Output
Create or modify logback.xml in your src/main/resources directory. We'll create two separate appenders: one for general application logs and one specifically for SQL statements.
<configuration>
    <appender name="CONSOLE" class="ch.qos.logback.core.ConsoleAppender">
        <encoder>
            <pattern>%cyan(%d{yyyy-MM-dd HH:mm:ss.SSS}) %highlight(%-5level) %magenta([%thread]) %boldYellow(%-40.40logger{39}%n)  %boldWhite(→) %msg%n</pattern>
        </encoder>
    </appender>

    <appender name="SQL" class="ch.qos.logback.core.ConsoleAppender">
        <encoder>
            <pattern>%boldMagenta(%n┌─ SQL ─────────────) %cyan(%d{HH:mm:ss.SSS}) %yellow([%thread]%n) %boldGreen(%msg%n) %boldMagenta(└───────────────────%n)</pattern>
        </encoder>
    </appender>

    <logger name="net.ttddyy.dsproxy.listener.logging.SLF4JQueryLoggingListener" level="DEBUG" additivity="false">
        <appender-ref ref="SQL"/>
    </logger>

    <root level="INFO">
        <appender-ref ref="CONSOLE"/>
    </root>
</configuration>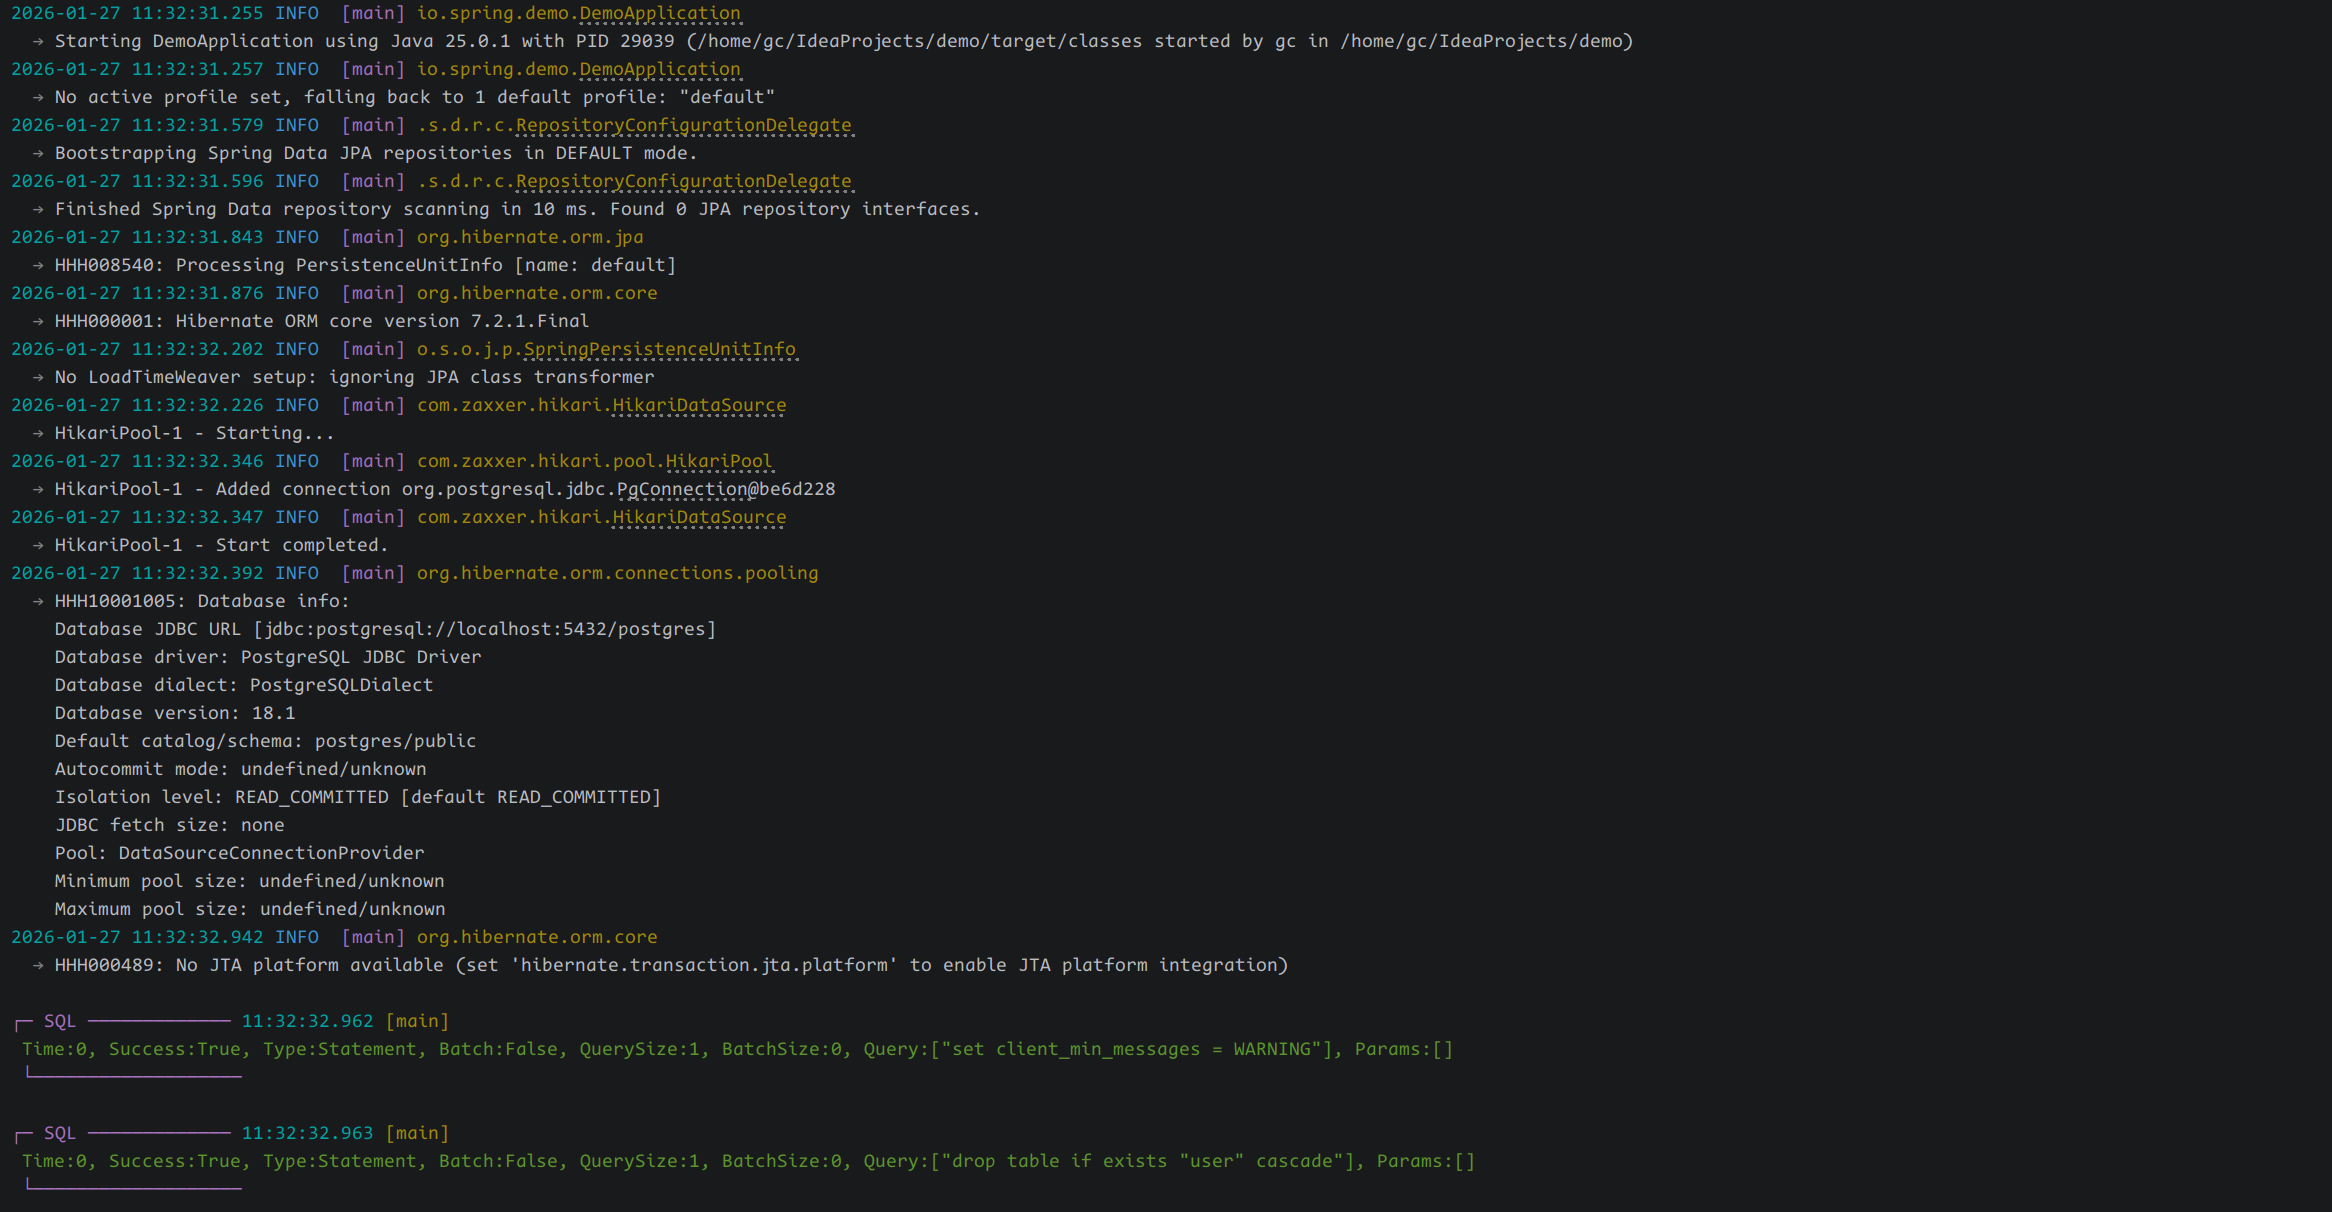
Logger Configuration:
The <logger> element specifically targets the datasource-proxy's logging listener. Setting additivity="false" prevents SQL logs from also appearing in the CONSOLE appender, avoiding duplicate output.
Root Logger: All other logs (not matching specific loggers) go through the root logger at INFO level, using the CONSOLE appender.
Color Syntax
Logback supports these color patterns:
- Basic colors:
%black,%red,%green,%yellow,%blue,%magenta,%cyan,%white - Bold variants:
%boldRed,%boldGreen, etc. %highlight- Auto-colors based on log level
Controlling Log Levels
The log levels can be overridden in your application.yml:
logging:
  level:
    net.ttddyy.dsproxy.listener: DEBUG
    root: INFO
In production, you might want to disable SQL logging entirely:
logging:
  level:
    net.ttddyy.dsproxy.listener: OFF
Dependencies
<dependency>
    <groupId>net.ttddyy</groupId>
    <artifactId>datasource-proxy</artifactId>
    <version>1.11.0</version>
</dependency>
Or in build.gradle:
implementation 'net.ttddyy:datasource-proxy:1.11.0'